Retinotopic Mapping#
Further Reading
This page introduces retinotopic mapping at a high level but is not intended to be a thorough treatment of the subject. For a more detailed treatment of retinotopic maps, we recommend a review article by Ribeiro et al. [2025].
The visual cortex is tiled with distinct functional regions, and in many of these regions is a retinotopic map. Retinotopic maps are maps in which a topologically preserved representation of the visual field (or retina) can be found. In other words, within a functional region, points on the cortical surface process visual input from points in the visual field; further, points nearby on the cortical surface process points nearby in the visual field, making a smooth map from the visual field (onto the retina, and) onto the cortical surface. Figure 6 shows a rough approximation of how the visual surface is mapped onto the cortical surface across many functional visual areas.
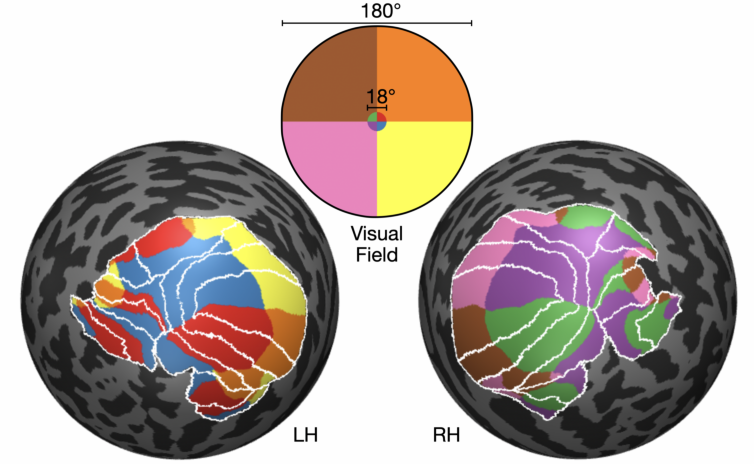
Figure 6. Spherically inflated cortical surfaces of an example subject, colored according to the part of the visual field to which they respond. White contours show the boundaries between distinct functional areas on cortex. The innermost 18° of the visual field is represented by close to half of the cortical surface despite occupying only a small part of the visual field. The magnification of the fovea on cortex relative to the periphery is called cortical magnification.#
Retinotopy mapping is a set of experimental methods for measuring the mapping of the visual field onto the cortical surface. Although there are many methods for retinotopic mapping, fMRI is by far the most common method of measuring retinotopic maps in humans. (See the chapter on MRI for more information.)
To measure retinotopic maps using fMRI, a subject typically keeps their eyes fixated at the center of a screen while some combination of drifting bars, rotating wedges, and expanding/contracting rings filled with flickering patterns move across a gray background. These flickering regions of the screen cause neurons in the retinotopically matched parts of cortex to fire, leading to changes in the BOLD signal measured by the MRI. (See the fMRI section for more information on BOLD.) By modeling the elevation in the BOLD signal in terms of the position of the stimulus on the screen, we can determine which parts of the visual field is drives activity in each position on cortex.
Population Receptive Fields (pRFs)#
Individual neurons in the visual cortex receive input from a particular region of the visual field called a receptive field (RF) that is roughly similar to a disk or 2D Gaussian blob. A voxel that is measured by fMRI typically contains a population of hundreds of thousands of neurons so it instead has a population receptive field (pRF). PRFs are modeled in many ways, but the most commonly used model is as a 2D Gaussian blob with a size \(\sigma\) and a position in the visual field, usually represented in polar coordinates \((\theta, r)\), with \(\theta\), the polar angle, giving the rotation around the fovea and \(r\), the eccentricity giving the distance from the fovea in degrees of visual angle [Dumoulin and Wandell, 2008]. These properties are shown in Figure 7.
What is a degree of visual angle?
Positions in the visual field can be measured using Cartesian coordinates (\(x\) and \(y\)) or using polar coordinates (polar angle \(\theta\) and eccentricity \(r\)). The coordinates \(x\), \(y\), and \(r\) are usually measured in degrees of the visual field. Wherever we point our eyes, the visual field is essentially made of approximately half of a sphere of light that enters our eyes and travels through our visual system. At the center of the visual field is the fovea, and eccentricity (\(r\)) is simply the degrees along the sphere away from the the fovea.

Figure 7. A pRF in the lower left quadrant of the visual field, represented by the roughly Gaussian cyan blob.#
The idea behind using a Gaussian blob as a pRF model is that the response of the voxel to a stimulus will be proportional to the overlap of the voxel’s pRF blob with the stimulus. So if the stimulus is a slowly drifting bar filled with flickering patterns, then when the voxel’s pRF response will be strongest when the bar perfectly overlaps the Gaussian blob, weakest when the bar is farthest from the blob, and intermediate when the bar partially overlaps the blob. Of course, what the stimulus contains is also important for knowing how strongly a voxel will respond to a stimulus. In retinotopic mapping experiments we tend to ignore the content of the stimulus because we use high-contrast patterns like flickering high contrast images that are known to strongly drive visual system responses. Nonetheless, because some functional visual areas on cortex respond to different aspects of the stimulus, some regions respond much more strongly than others for any one stimulus and thus produce stronger or weaker responses during retinotopic mapping experiments.
Movie 1 show sped-up examples of the stimulus used during an actual retinotopic mapping experiment. These videos are played at high speed, but the actual experiment takes several minutes during which the patterns in the video, in the forms of flickering bars or rings and wedges, drift slowly across the screen. This slow movement of the visual stimulus results in a similar slow movement of the responses across cortex, allowing us to deduce the location and size of each voxel’s pRF.
|
Movie 1. Videos of the stimulus used in a retinotopic mapping experiment (shown at high speed). Because the visually interesting part of the stimulus slowly drifts across the visual field parametrically, it can be used to determine the pRF of each visually-responsive voxel in the brain. | |